While most people quickly find dayz_infectionTreshold to change the infection rates, it isn't particularly clear what the threshold means.
One complication is that the probability of being infected isn't based on a uniformly distributed random variable; instead, DayZ first generates a uniform random variable for the hit damage and then uses the damage (modified by the current blood level) as a maximum for a subsequent uniform random variable to be generated, which is then compared against the threshold. The CDF of the variate is a messy piecewise function with linear-log and inverse hyperbolic pieces, so rather than work with that I've produced a set of graphs.")
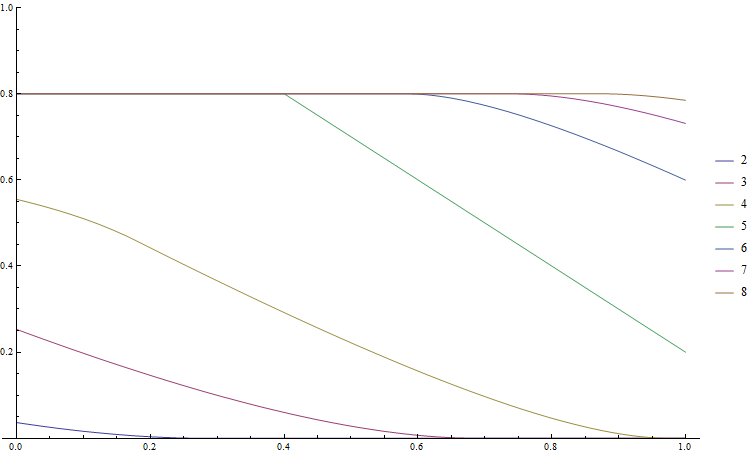
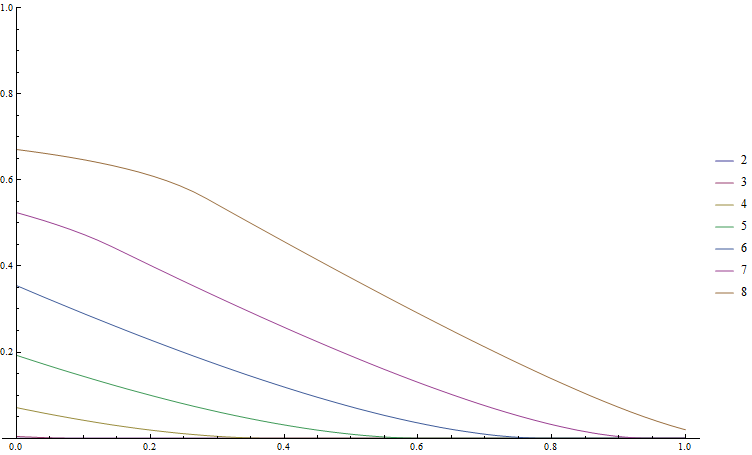
The graphs show the probability (on the left axis, ranging from 0 to 1) of being infected each zombie hit, depending on your blood level (shown on the bottom,with 0.0 being no blood and 1.0 being full blood), and also depending on how many zombies are within a 5 meter radius of you (each line represents a count of zombies).
For example, for dayz_infectionTreshold = 1.25, your probability of being infected from a single hit with 4 zombies near you ranges from 0.55 (55%) at no blood to 0.0 (0%) at full blood. With 6 zombies it stays at 100% from 0% blood to around 60% blood, and then goes down to 60% probability of infection.
Virus zombies are treated somewhat differently. If there is one virus zombie within 5m of you, each zombie (including the virus zombie) counts as 4 zombies.
Here's the graphs; to use them you basically find the graph you want and then set dayz_infectionTreshold in your init.sqf some time after variables.sqf is executed.
dayz_infectionTreshold = 1.25
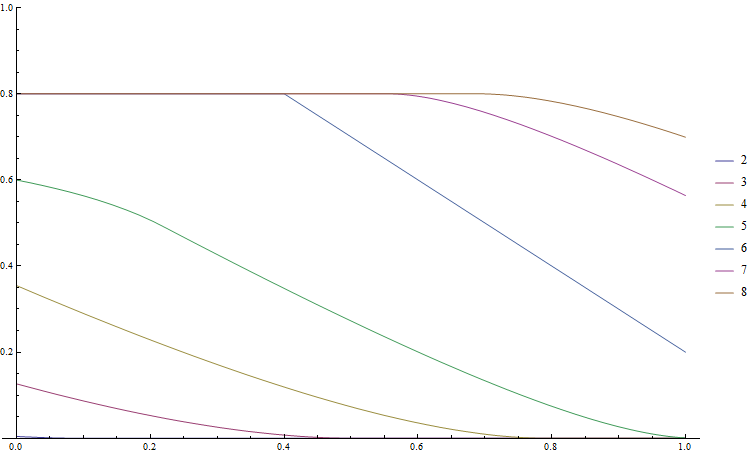
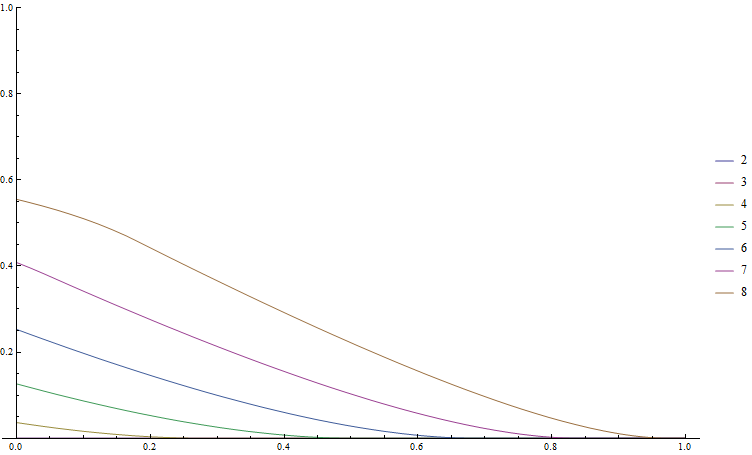
dayz_infectionTreshold = 1.5
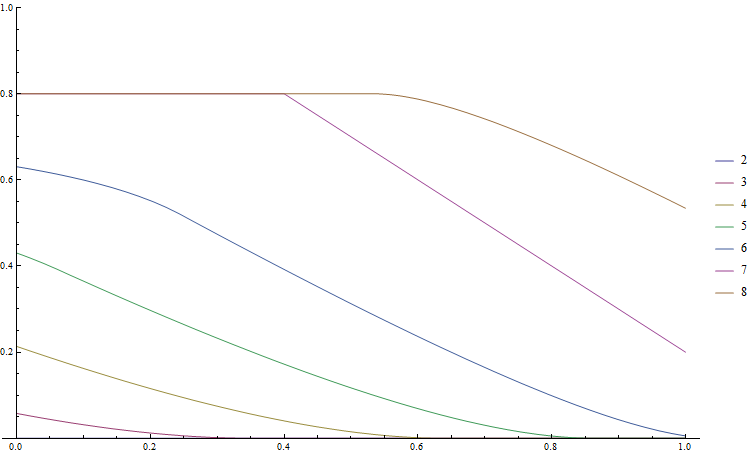
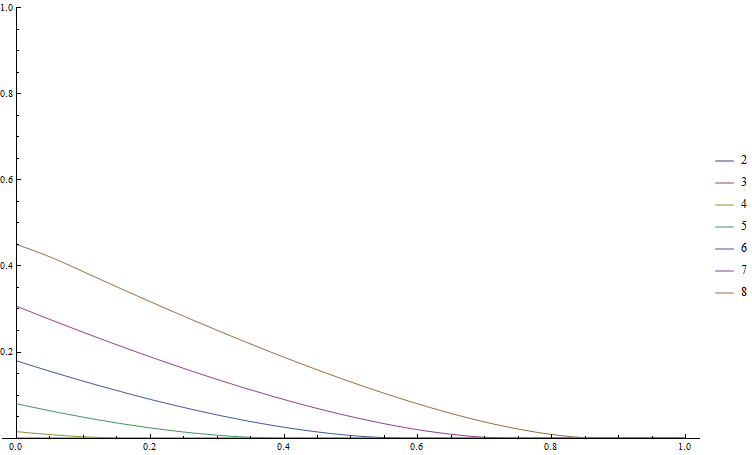
dayz_infectionTreshold = 1.75
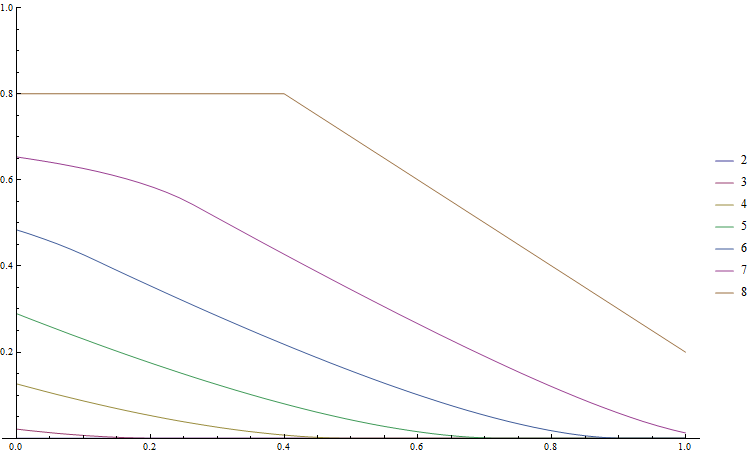
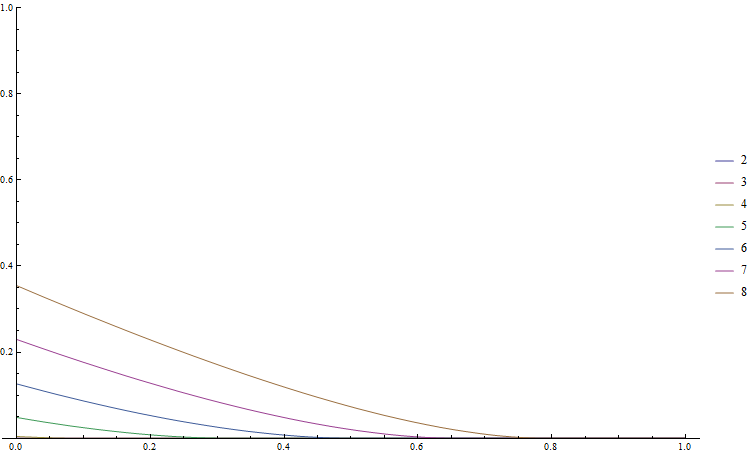
dayz_infectionTreshold = 2
dayz_infectionTreshold = 2.25
dayz_infectionTreshold = 2.5
dayz_infectionTreshold = 2.75
dayz_infectionTreshold = 3
If anyone wants to verify the above, these graphs are based on the following joint PDF:
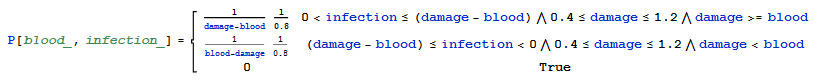
The value of "infection" variate is then compared to Log[dayz_infectionTreshold / (0.25 * zombies)]. The graphs above have also been verified with monte carlo testing with code fairly close to what's in the DayZ code.
One complication is that the probability of being infected isn't based on a uniformly distributed random variable; instead, DayZ first generates a uniform random variable for the hit damage and then uses the damage (modified by the current blood level) as a maximum for a subsequent uniform random variable to be generated, which is then compared against the threshold. The CDF of the variate is a messy piecewise function with linear-log and inverse hyperbolic pieces, so rather than work with that I've produced a set of graphs.
The graphs show the probability (on the left axis, ranging from 0 to 1) of being infected each zombie hit, depending on your blood level (shown on the bottom,with 0.0 being no blood and 1.0 being full blood), and also depending on how many zombies are within a 5 meter radius of you (each line represents a count of zombies).
For example, for dayz_infectionTreshold = 1.25, your probability of being infected from a single hit with 4 zombies near you ranges from 0.55 (55%) at no blood to 0.0 (0%) at full blood. With 6 zombies it stays at 100% from 0% blood to around 60% blood, and then goes down to 60% probability of infection.
Virus zombies are treated somewhat differently. If there is one virus zombie within 5m of you, each zombie (including the virus zombie) counts as 4 zombies.
Here's the graphs; to use them you basically find the graph you want and then set dayz_infectionTreshold in your init.sqf some time after variables.sqf is executed.
dayz_infectionTreshold = 1.25
dayz_infectionTreshold = 1.5
dayz_infectionTreshold = 1.75
dayz_infectionTreshold = 2
dayz_infectionTreshold = 2.25
dayz_infectionTreshold = 2.5
dayz_infectionTreshold = 2.75
dayz_infectionTreshold = 3
If anyone wants to verify the above, these graphs are based on the following joint PDF:
The value of "infection" variate is then compared to Log[dayz_infectionTreshold / (0.25 * zombies)]. The graphs above have also been verified with monte carlo testing with code fairly close to what's in the DayZ code.